
A location based understanding of mobile app user behavior
Diana Marques, University of Porto, Portugal / National Museum of Natural History, Smithsonian Institution, Portugal, Robert Costello, National Museum of Natural History, Smithsonian Institution, USA, Brian Alpert, Smithsonian Institution, USA
Abstract
Understanding differences in user behaviors with mobile apps developed for in-gallery experiences and offsite uses is a fundamental consideration when designing content for mobile devices. The user experience and engagement with mobile products are greatly dependent on a multiplicity of factors such as social context, time availability, noise and distraction level, personal comfort, and individual goals, all of which are related to the users’ setting. Developing an app that bears user location in mind can ultimately assist with successfully reaching a larger audience and extending the mobile product’s life cycle in the sense that mobile apps are disposable products. In order to understand user behaviors with one mobile app in different surroundings, we turn to analytic tools. As simple as this may seem, knowing the location of the device (and therefore the user) is not a trivial exercise, yet this information is paramount for comparing other user metrics. We suggest comparisons of user metrics with inaccurate location data compromises the study. For example, Google Mobile Analytics, one of the most popular tools, reports not on the location of the device but rather on the location of the Internet Service Provider, meaning that international or out-of-state visitors at the museum may be misleadingly reported as engaging with the app at their place of origin. Using the Smithsonian’s National Museum of Natural History mobile app, Skin & Bones, as a case study on location-based user behavior, we describe how we customized Google Mobile Analytics through events coding, filtering and segmentation analysis to retrieve accurate location data, which allowed us to compare app sessions taking place inside and outside of the Museum.Keywords: mobile, location, analytics, visitor behavior
Overview
Museum mobile apps have been developed with different use cases in mind, such as providing onsite service within museums, e.g., location services, enhancing the substance of exhibitions with ancillary content, and being an integral part of the exhibition design and experience (Burnette, 2012). According to existing surveys (Tallon, 2013) the leading mobile experiences are in-museum apps meant primarily to be used throughout the premises during in-person visits. Commonly those apps also aim to extend the museum experience beyond the onsite visit. Temporary exhibitions in particular may exploit exclusive features of mobile technology to enhance the in-gallery experience, and provide access to the content for individuals that cannot visit in person. The location of the user when engaging with the app is then one of the primary considerations that museum professionals have to account for when initiating a mobile project.
Using Google Mobile Analytics (GMA), we analyzed mobile app data to understand user behavior in a location-based context. The objective was to analyze the use of an exhibit-based app inside a museum exhibition and how it compares with the use of the app outside the museum. In this case, the onsite location is an antiquated exhibition inside the Smithsonian’s National Museum of Natural History (NMNH), known as the ’Bone Hall.’ For context, the Bone Hall is an evolutionary parade of nearly 300 articulated skeletons arranged in a series of connecting rooms containing fish, amphibians, reptiles, birds and mammals (Figure 1). Exhibit labels mostly refer to esoteric anatomical characteristics of groups of vertebrates, such as the orders of mammals, say little to nothing about individual species, and contain no images of the animals in life. The formidable combination of a lifeless exhibition design and specialized and abstruse text apparently motivates visitors to move along. Visitors use the Bone Hall as a pathway connecting one area of the museum to another and spend 1:34 (mode time, i.e., the most recurrent duration of the visit; 3:24 is the mean duration of the visit) in a space that is 82m long and contains 61 displays. Even if visitors do not dwell in the Bone Hall, as they would in other exhibitions at the museum, the space tends to be extremely crowded in peak visitation times during the year. Large groups and families with strollers contribute greatly to slowing or stopping the flow of traffic, and pose significant challenges to visitors with reduced mobility. The amount of people coupled with the hard surfaces and outdated construction, lead to ambient sound levels considerably above 80-90 decibels.

Skin & Bones was developed as a companion mobile app to the Bone Hall to resuscitate the exhibition by increasing the enjoyment and memorableness of the visitor experience, and improve the communication of the main organizing principles of the Hall to the visitor (Marques & Costello, 2015). The app is an option for visitors interested in delving beyond what is available in the physical space, but is not intended to replace the antiquated experience. The historical skeletal collection is preserved as it was meant to be in the 20th century and visitors can choose to experience the exhibition with a foot in either century. Although the primary use case for Skin & Bones was to serve as an onsite companion to the Bone Hall, it was also meant to be a content-rich tool offering engagement opportunities outside NMNH. Individuals that for one reason or another cannot visit the museum in Washington DC, can use Skin & Bones to unlock the science and nature stories associated with the skeleton collection and visitors that went to the Bone Hall can relive their in-gallery experience and further explore content when no longer in the building.
The app contains 32 videos, 4 activities, and notably, 10 Augmented Reality (AR) pieces. The AR works with object recognition and 3D tracking to accurately superimpose static and animated 3D digital models onto skeletons on display from as large as a 6m long Steller’s sea cow to a diminutive 8cm common vampire bat. AR is uniquely suited to be experienced in the Bone Hall and at the time we completed this study the app was not capable of triggering the augmented content outside of the exhibition. A subsequent app upgrade enabled AR offsite.
We tailored both the user interface and content for dual-location use. We expected changes in motivation and environmental factors would drive differences in patterns of behavior based on location, yet we could not know exactly what they would be. In that sense we were designing blindly. Based on less rigorous observations of visitors watching videos in other exhibitions within NMNH, we assumed users would lightly sample video while in the exhibition and spend more time viewing video offsite. Time constraints, crowding and noise are likely to influence behavior with each of the three content types offered by Skin & Bones. We wanted to know whether our assumptions were valid and if so, to what extent. We intentionally produced a lot of video in light of what we already knew about the low sampling rate of visitors with video in exhibitions at NMNH, yet with the expectation and hope that they would sample them more thoroughly away from the museum. Taking a piece of the exhibition home to relive and reconnect without the same time constraints was a goal for extending the experience.
The app is a bring-your-own-device model and visitors to the Hall can connect to the free Wi-Fi network provided by NMNH to download the app to their devices. With visitors in the exhibition connected to the museum Internet service and users outside the museum connected to other services, it should be relatively easy to distinguish onsite and offsite users. However, two confounding variables presented a more complex situation. A large number of onsite users did not opt to use the free Wi-Fi and instead used their cellular data plans. The other more general case is how GMA reports user location by indicating the location of the user’s Internet Service Provider (ISP) rather than the geographic location of the mobile device. Thus, a user connected through cellular service in the museum in Washington, DC can be reported as a user in San Francisco, CA.
Methods
GMA data are best interpreted as trends and should be used for comparison purposes only. Given the sketchy nature of data retrieval from analytics tools, and considering that GMA uses a sampling process that is not disclosed, it is best to treat the data within limits. The results from any user of a GMA enabled app that downloads the app and opens it at least once, regardless of the location, might become part of a dataset. However, the information about that user cannot be accessed separately from the information gathered from other users. The GMA online dashboard only displays aggregated data across categories for any selected period within an app’s lifetime.
For Skin & Bones, separating users into two locations (inside the museum and offsite) and extracting informative data on their behaviors was a layered process that involved coding on the back end of the app and filtering and segmenting on GMA.
Coding
GMA “events” are used to collect data about interactions with particular pieces of content and functions within apps and require adding tracking code during app development. For this study, the purpose for coding events was to monitor the frequency and duration for viewing of videos, activities, and AR experiences by all users of the app.
The GMA code was integrated into the Skin & Bones code to record each time a user presses play to watch a video, triggers an AR resource, or completes an activity. Also, when a video is played for more than 80% of its total duration, GMA counts one “play event” plus one “played 80% event”—the remaining 20% of the videos account for the credits that users are less likely to watch. Therefore, if the user is identified with one “played 80% event,” she is considered to have watched the entire video. The “AR triggered event” could only be recorded in sessions taking place in the Bone Hall given that the augmented content was not available anywhere else at the time of this study. Thus, by default, an AR event locates the user in the exhibition.
Filtering
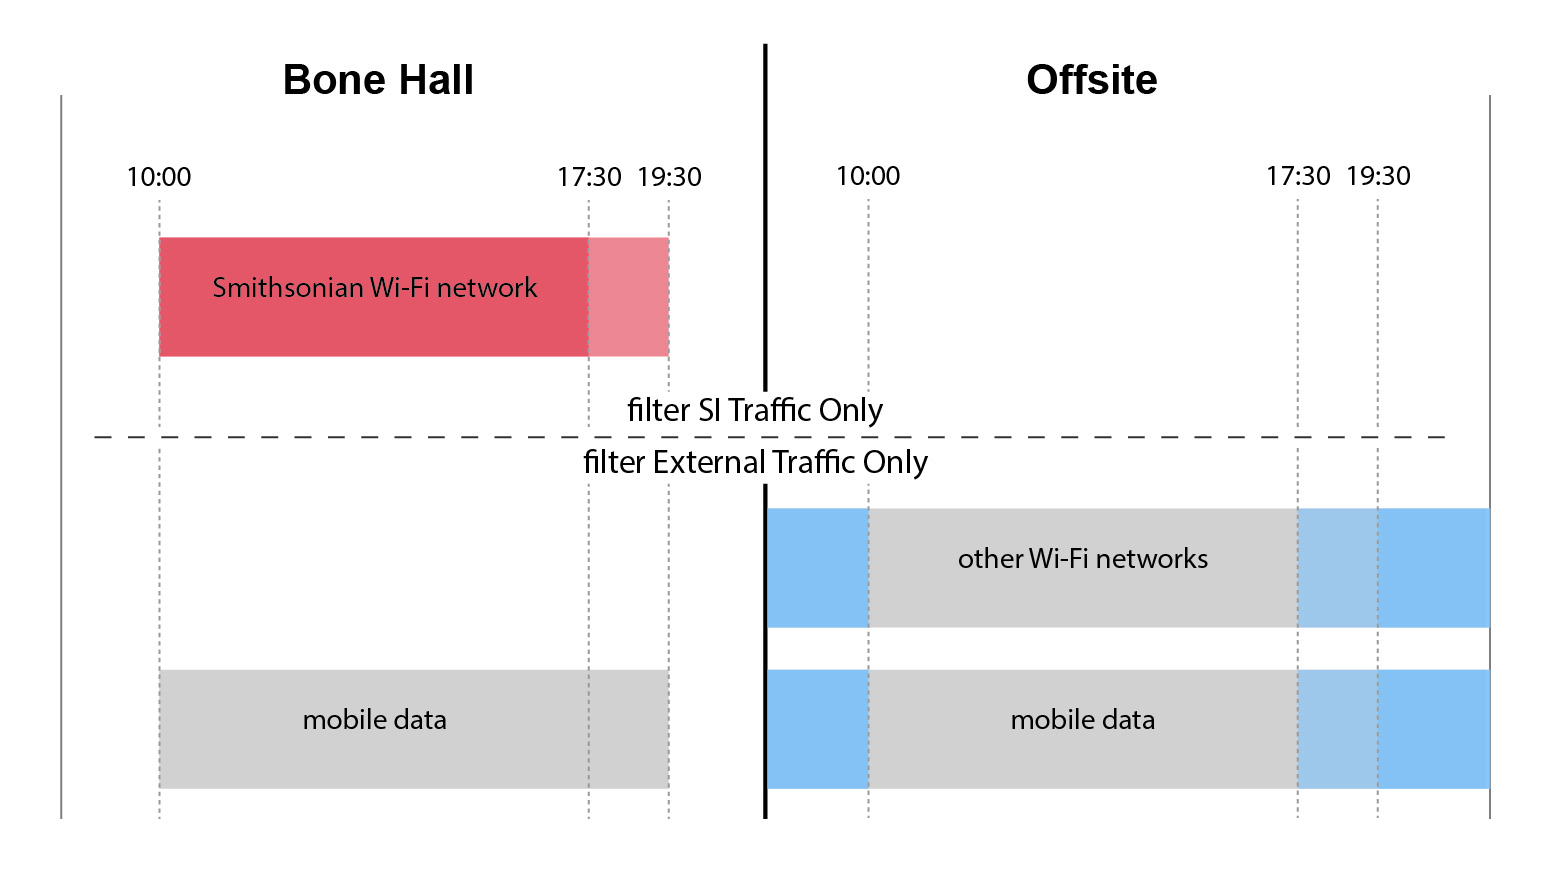
Two GMA filters were created upon the public release of the app since filters do not operate retroactively. The filters use the Smithsonian Wi-Fi network IP address, which can be identified by a unique number sequence, as the differentiating criterion. The “SI traffic only” filter retrieved GMA data from individuals connected to the museum network. The “external traffic only” filter retrieved all other data, i.e., from individuals connected to any other Wi-Fi network or utilizing their own mobile data plan. The data collected by the first filter is from individuals using the app in the exhibition. Data from the second filter includes a mix of individuals outside of the exhibition (using Wi-Fi and cellular data plans) and individuals in the exhibition (on cellular data plans) and on its own cannot be considered clean enough for analysis of offsite behavior.
Segmenting
GMA data segments can isolate and analyze subsets of the entire dataset according to customized criteria. When combined with the internal and external traffic filters, segmenting allowed for discrimination of location-based behavior profiles of Skin & Bones users inside and outside of the Bone Hall.
The segments “visitation summer hours” and “visitation winter hours” isolated data that was collected by GMA while NMNH was open in the summer (10:00AM-7:30PM) and during the rest of the year (10:00AM-5:30PM). When used in combination with the internal traffic filter, the data that reflects engagement with videos, AR and activities was assuredly generated by users while in the exhibition (data segment represented in red in Figure 2).
The segments “non-visitation summer hours” and “non-visitation winter hours,” isolated data collected for when the museum was closed. When used in combination with the external traffic filter, the location-based profile is solely of users from outside of the exhibition (data segment represented in blue in Figure 2).
This filtering and segmentation method does not analyze data pertaining to all Skin & Bones users for a certain period of time, and there is no reliable information regarding the total number of individuals that downloaded and used the app in the Bone Hall versus the total number of those who used it outside of the museum. In this study the NMNH user segment represents 33.8% of all Skin & Bones users, and the segment pertaining to external users represents 27.3% of the app users. Although the data analyzed is 61.1% of the total dataset, this method circumvents the problem associated with the GMA reported user location being synonymous with the ISP location. This method isolates data from a subsample of users that were surely at the exhibition and data from a subsample of users that were guaranteed to be outside of NMNH, which then provides the opportunity to compare their behaviors and overall profiles.
In addition to GMA data analysis this study also conducted interviews with visitors to the Bone Hall that were invited to use Skin & Bones in museum iPads allocated to the research project.
Results
After parsing the data a few trends emerged that convincingly show that user behaviors are different within and outside the exhibition. One trend is choice of device. As an iOS based app, users do have a few device choices – iPad, iPod, and iPhone. iPod users were so few that data was compared only between using a personal iPhone or an iPad while visiting NMNH versus another location. Table 1 results show a shift from a 4:1 iPhone to iPad ratio in the exhibition to less than 3:1 outside the exhibition.
|
Sessions in the Bone Hall |
Sessions Outside |
|
|
Sessions with iPad |
13.4% |
34.1% |
|
Sessions with iPhone |
82.9% |
63.7% |
|
Average Screens/Session |
14 |
6 |
Table 1: comparison between Skin & Bones sessions in the Bone Hall (n=4,919) and outside of the museum (n=4,507) regarding the number of sessions with iPad, number of sessions with iPhone and average number of screens per session, for the time period of January 2015 – January 2016
Results additionally show that users outside of the museum tend to conduct considerably more long sessions (>3:00) and fewer short sessions (1:00 or less), than users in the Bone Hall; however, as seen in Table 1 those sessions go through, on average, less than half the number of screens than sessions that take place in the exhibition. One other aspect of session duration is that they last longer on an iPad – average of 8:23 when compared to 5:02 on an iPhone – even if the average number of screens per session is approximately the same, 9.3 on an iPad and 9.2 on an iPhone. Therefore, users outside of the museum spend more time with the app in longer sessions, and more so if they’re using a larger screen (iPad). They also spend more time with individual pieces of content, even if they see a smaller number.
GMA is capable of differentiating new users from returning users through an anonymous unique identifier that tags each device that launches the app for the first time throughout the lifetime of the app. Figure 3 compares the percentage of new and returning sessions for users in the Bone Hall and offsite. It shows that most are new sessions, particularly at the museum. This was expected given that the app was predominantly promoted inside the exhibition through posters and led to greater awareness and first-time use in situ. There was no active promotion outside of the museum, only some media coverage during the first few months of the app. The results also reveal the number of returning users was overall low and despite GMA limitations regarding the location of the users, it is probable that revisiting sessions took place offsite. Previous studies conducted at the Museum and across the Smithsonian Institution (Bielick, Pekarik, & Doering, 1995; Bitar, Pekarik, & Renteria, 2013; Doering & Pekarik, 2010; Marino et al., 2004) indicate that the year-round audience is mostly composed of first-time visitors. Returning users of Skin & Bones were likely to be first-time visitors to the Museum who engaged again with the app after they were no longer in the building, either during visitation or non-visitation hours.
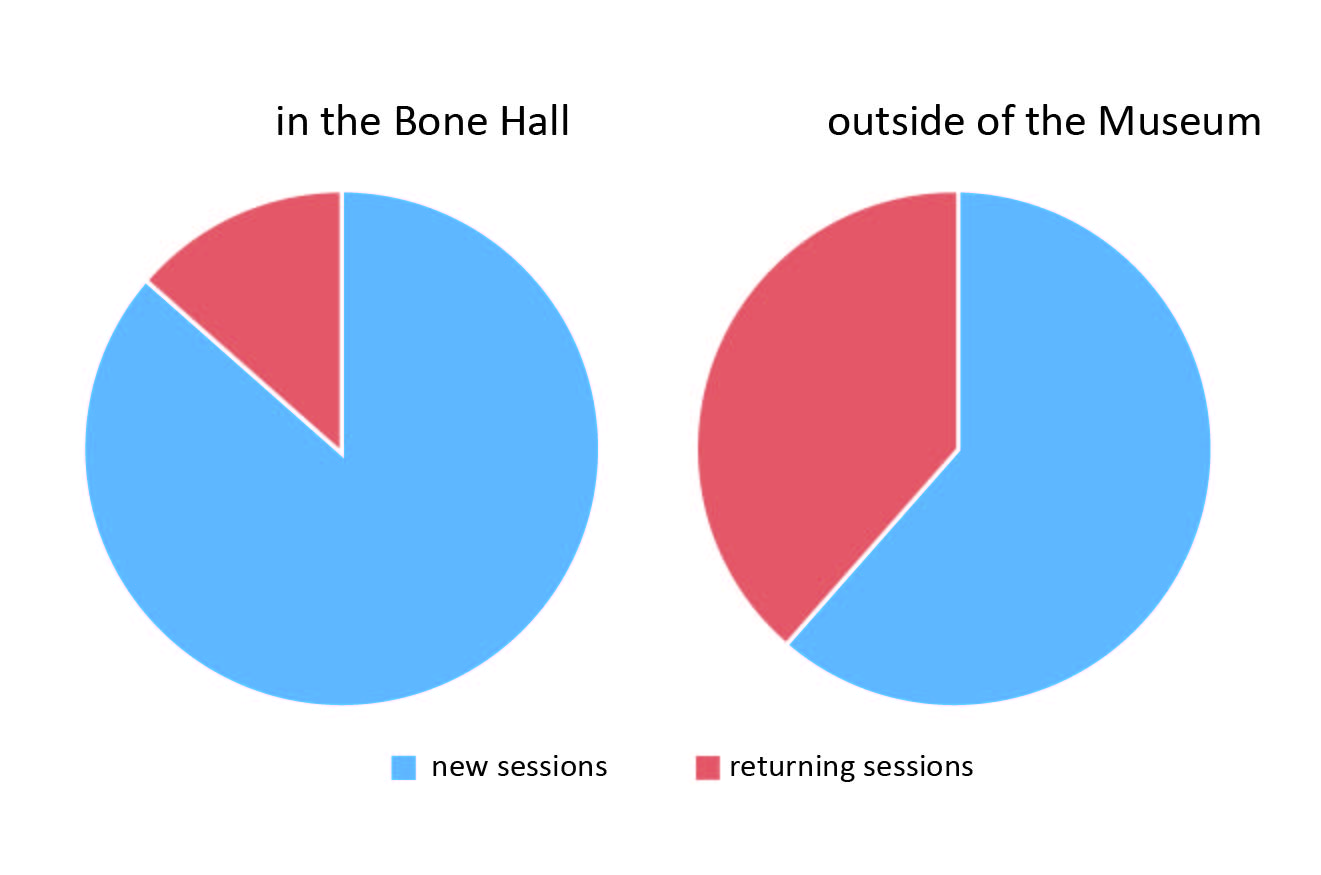
Table 2 illustrates the popularity of the AR content in Skin & Bones when compared to videos and activities among users that were conducting sessions in the exhibition – 65.3% of the sessions triggered AR content whereas only 32.4% played video and 2.3% played activities. Outside of the museum the augmented content was not a choice, and activities were more significant in the total number of events and users played more videos indicating an effect of content replacement attributable to AR.
|
Sessions in the Bone Hall (%) |
Sessions Outside of the Museum (%) | |
| AR Triggered | 65.3 |
N/A |
|
Video Play |
32.4 | 87.8 |
| Activity Completed | 2.3 |
12.2 |
Table 2: comparison between the percentage of Skin & Bones sessions in the Bone Hall and outside of the museum regarding the occurrence of GA event actions AR Triggered, Video Play and Activity Completed, for the time period of March 2015 – January 2016
One interesting aspect of video viewing is the obvious difference in completion rate between Bone Hall sessions and sessions everywhere else. Whereas only 26.3% of videos watched at the exhibition were seen to completion, 45.7% of those viewed offsite were played to the end. This supports the earlier findings of greater attention span in an offsite environment being more favorable to longer sessions and to spending extra time with individual pieces of content.
One other supporting aspect of the content disruption effect of the Bone Hall on users is shown by activity preference and completion. The two activities that are the least complex, easiest to understand and the most haptic were favored at the exhibition. The most complex activity with an increasing level of difficulty requiring greater concentration, therefore extra dedication, was favored by offsite users who were also more persistent in continuing on to level two after completing the first level with success, when compared to in-gallery users.
The analysis of content type viewing according to location and device used is equally interesting and illustrated in Table 3. In-gallery iPad users gave preference to watching videos when compared to in-gallery iPhone users. In fact, their video completion rate was 30.6% and only 13.7% for iPhone users in the Bone Hall. Outside the museum differences in screen size barely affected the type of content viewed.
| Sessions in the Bone Hall (%) |
Sessions Outside of the Museum (%) |
|||
|
iPhone |
iPad | iPhone | iPad | |
|
AR Triggered |
71.5 |
50.7 | N/A | |
| Video Play | 27 | 45.4 | 51.6 |
47.8 |
| Activity Completed | 1.5 | 3.9 | 48.4 |
52.2 |
Table 3 – Comparison of the percentage of GMA event actions AR Triggered, Video Play and Activity Completed that occurred in sessions in the Bone Hall and outside of the museum conducted on iPhones and iPads, for the time period of March 2015 – January 2016.
In conclusion, the bimodal analysis of the app showed marked differences between the two locations in the devices used, the depth of the app sessions and engagement with content. Even with the exhibit displays setting the ideal context for users, within the exhibition they were impaired by time limitations, personal agendas, social demands and the conditions of the environment, which likely shortened the attention span of the visitors. Nevertheless, some found value in the fact they could return to the app after the visit to share their experience or use the app as an educational resource, as the interviews revealed.
Visitor 1: “Surely we didn’t do all of the videos either, because we’re pressed for time and we don’t want to spend a whole lot of time in one exhibit, and some of the videos are like three and half minutes long.”
Visitor 2: “What if you were to download the app, could you watch this stuff later?”
Research Assistant: “Yes.”
Visitor 2: “So that I think it would be… if we actually had the app to be able to go back and sort of re-watch that stuff.”
“It would be a way to share knowledge, and not everyone is going to be able to come out. ‘Here’s all the pictures and video we took and also there’s this,’ you have an iPhone and pull this out, ‘this is just one section of one of the museums to give you a taste of what’s there.’”
“And it could be used for the kids too. So they come on a tour, they go back to school, they have to do something for class about it, they could bring it back up.”
Discussion
As a group, museum visitors appear to be keenly aware of their time and move through the large, permanent exhibitions in under 15:00 and often half that amount. As mentioned, from existing studies we know most visitors are at NMNH for the first time, and their agenda is often to see as much of the museum as possible. Using a mobile app slows down the visitor, which is what exhibition designers strive to achieve, yet in this setting it is somewhat at odds with the pace visitors set for themselves. When not using Skin & Bones in the Bone Hall, visitors dwell an average time of 3:24, whereas with the app the average in-gallery time is 14:00. This is likely about as much time as can be expected in this setting and it can be interpreted with some measure of success. Another measure is stopping coverage (the percent of stops for all possible stops). The stopping coverage of the Bone Hall increased from 5% to 19% after Skin & Bones was made available, and became nearly identical to the stopping coverage of another more modern permanent exhibition at the museum. This reflects the visitors’ sense of how much time they can expend on an experience of interest. Our findings suggest they were visibly impaired by time constraints, social demands and the conditions of the environment as indicated by shorter app sessions and viewing of fewer pieces and shorter durations of content.
Understandably, the offsite visitor, and especially the iPad user, had a greater appetite for consuming content in depth and the correlation to screen size reveals the obvious sense of pleasure associated with larger screens – movie theaters being the zenith of this trend and small mobile phone screens being the nadir. But what is the effect of the device on behavior within an exhibition? Does screen size matter or is the exhibition environment the governing mechanism controlling content viewing? For museums considering handing out devices, this is an important consideration. The data from this study suggests there are differences in behavior associated with different screen sizes within the exhibition, but not outside the museum. We think there is an interplay between the constraints of the environment and screen size. At the Bone Hall visitors with iPads were more invested in video—they viewed more and completed more. iPhone users saw the inverse—lower video use and completion, and higher AR viewing. This suggests tablets are preferred mobile devices for viewing and listening to video within an exhibition setting.
We suggest museum mobile app development should be mindful of these differences and design experiences with multiple use locations in mind. Important decisions include screen size versus device portability, and amount, depth and duration of content. The bimodal in-gallery and offsite model of Skin & Bones extended the opportunity for engagement beyond the physical space of the exhibition, and facilitated different experiences according to the user location. Unless a museum is looking into providing an exclusive on-site experience to draw in visitors, or specifically wants to develop a tool that is external to its galleries, it seems advantageous to adopt a bimodal model and attentively consider the different settings that users might find themselves in when using the mobile tool.
The idea expressed by participants seeing the app as a continuation of the museum aligns perfectly with the museum professionals’ argument for the use of mobile as an extension of the experience.
Through customization of a free and widely-used mobile app analytics tool we were able to circumvent some of the inherent challenges associated with collecting and analyzing location based data. Even when the absolute and total number of users cannot be determined, differences in behavioral patterns can be uncovered. We were able to apply 61.1% of the GMA data to the analysis, which suggests smaller museums with fewer users can achieve large enough samples to analyze user behavior with confidence using the same method.
Acknowledgements
The production of Skin & Bones and research were supported by the Booz Allen Hamilton Corporation, the co-funding of the European project POPH/FSE, and a grant from the Foundation for Science and Technology (SFRH/BD/51840/2012), under the UT Austin|Portugal CoLab. The production and research were also supported by the Smithsonian Digitization Program Office, and the offices of Education & Outreach, Exhibits, Vertebrate Zoology, and Photography and Media at the Smithsonian’s National Museum of Natural History.
References
Bielick, S., Pekarik, A. J., & Doering, Z. (1995). Beyond the Elephant. 31. Washington DC: Institutional Studies Office, Smithsonian Institution.
Bitar, S., Pekarik, A. J., & Renteria, J. (2013). Visitor Experience Summary Report. 9. Washington DC: National Museum of Natural History, Smithsonian Institution.
Burnette, A. (2012). So many devices, so many options: an introduction to cross-platform thinking. In N. Proctor (Ed.), Mobile apps for museums: the AAM guide to planning and strategy. 87–92. Washington DC: The AAM Press.
Doering, Z. & Pekarik, A. J. (2010). Nature, science and culture on display. Washington DC: Office of Policy and Analysis, Smithsonian Institution.
Marino, A., Doering, Z., Ernst, K., Karns, D., Kaufmann, C., Munteanu, I., et al. (2004). Results of the 2004 Smithsonian-wide survey of museum visitors. 18. Washington DC: Office of Policy and Analysis, Smithsonian Institution.
Marques, D. & Costello, R. (2015). “Skin & bones: an artistic repair of a science exhibition by a mobile app.” Midas. http://doi.org/10.4000/midas.933
Tallon, L. (2013). Mobile Strategy in 2013: an analysis of the annual Museums and Mobile survey. 22. London: Pocket-Proof & LearningTimes.
Cite as:
Marques, Diana, Robert Costello and Brian Alpert. "A location based understanding of mobile app user behavior." MW17: MW 2017. Published January 31, 2017. Consulted .
https://mw17.mwconf.org/paper/a-location-based-understanding-of-mobile-app-user-behavior/